Architectural survey had been contaminated by digital culture that has opened new frontiers and one of the most interesting results is the photomodelling. This dissertation is not the result of expert studies from who, with “art”, develop software, but from a point of view of someone who is studying and working on surveying and has tasted and had learned by experience use with this technique and the respective free software.
First it is important start with the definition of photomodelling as the process of operations made in a digital context with which, beginning with raster images, it is possible to attain a three-dimensional model. During the last years, these techniques are having great success in the field of conservation and enhancement of cultural heritage, proving to be one of the major breakouts of passive detection.
Photomodelling is the result of the digital revolution that influenced all the artifacts of our culture, from images to tools for interpretation and design, and it can be considered as a development of photogrammetry, a science that allows the ability to attain reliable information about physical objects and surrounding environment through registration's processes, measurement and interpretation of photographic and digital images formed by radiant electromagnetic energy and other physical phenomena.
As a matter of fact, the requirements imposed by this definition are the very same ones that set up the path of photomodelling which allows one to identify measurable points in three-dimensional space, resulting in the process of interpretation of digital images. There is still a need to verify the requirement of reliability of information, a prerogative questioned mostly by an automated process that has to be understood in its procedural logic so that it can eventually prove its application in a scientific survey.
The process of photomodelling involves each frame, to be understood in its new meaning of digital matrix of numeric data: it is through a comparison that the correspondence between data is identified and, based on epipolar geometry that supports the principles of monoscopic photogrammetry, the position of each pixel characterized by a color that determines the texture of the model is valued.
If the laser scanner is a technology based on the physics of the waves, then photomodelling takes advantage of the principles of optic, leading to simplicity and low priced tools: a simple digital camera, reflex if possible to have optimization in luminance noise and lens deformation. The great advantages are therefore tied to the expenses, extremely circumscribed, to its application to solve accessibility problems, and to the possibility to attain detailed models. New technologies make digital cameras with excellent CCD, raster files defined by millions of pixels, and, in proportion, the outcome of photomodelling reaches this order of points. In particular, the perceptive aspect of the three-dimentional model is going to have extremely significant results, being characterized by a mapping purely corresponding to reality. Instead, the main disadvantages are tied to a deep dependency on the environmental survey, that is on the intrinsic relationship between the generated images and the attained model, and it is evident how, depending on the environmental light, the lack of satisfying results is probable.
From the operative point of view, photomodelling is executable through several programs that are often deeply dissimilar. This analysis, which is a result of a personal itinerary of research, aims to put forward the employment of two free software, ARC3D and MeshLab, produced in collaboration by Visual Computing Lab of CNR-ISTI (Italy) and ESAT-PSI Lab of K.U.Leuven (Belgium), both connected to network EPOCH.
ARC3D is a web service that receives photo files to send them back along with the camera's calibration, a map of the depths and a map of the quality of each image, parameters from where it will be possible to get a spatial attribute and its reliability through a comparison between frames. It is extremely simple to attain data useful for the creation of the cloud: just take a picture of the object, send the images to the server, and, after having received the signal of occurred reconstruction, download the processed files. Nevertheless, it is important to verify that the pictures sent are not blurred before processing them with the function Check blurry images. In fact, this would compromise the final quality of the digital outcome.
The model takes form from the starting image. Consequently, a correct selection of the frames will positively influence the accuracy of the final result. In particular, the image should not only be limited to the examination's area, the frames should not be too distant from one another, and, even if there is no need to station in a referenced way from the object, it would be good to follow a semicircular path with pictures every 15-30° or so, attaining in this way, thanks to the equidistance between frames, a sequence of images easily comparable. As it happens for laser scanning, the estimated cloud is going to be marked by cones of shadow consequential to the frames. These imperfections must be duly corrected in the finishing process and optimized lining complementary clouds.
Differently from other software, ARC3D requires neither the camera's calibration nor the referencing of the holding point. As the name itself already suggests, ARC3D is the acronym for Three-dimensional Automatic Reconstruction Conduit, the program automatically creates a correspondence between images, automatically calculates the calibration of the camera and, again, automatically finds the correspondence between the elements known from the protective geometry of the representations.
As Vergauwen and Van Gool explain in the paper Web-based 3D reconstruction service, these operations, linked to technologies known in literature as Structure from Motion pipeline, are based on a comparison between the correspondences of all the sent files that are uncalibrated images. Therefore, its methodology is different from the most common procedures of opportunistic pipeline facilitated by the sequential disposition of the frames. Every pair of pictures is mutually measured through a Global Image Comparison's algorithm with which, following the juxtaposition of the raster matrix, each corresponding element is used to build an epipolar geometry. Trough Normalized Cross Correlatio's functions, matrix systems are applied and processed in parallel (parallel pipeline), a calculation that would require too much effort if beforehand it was not imposed by a subsampling, reduction that allows to optimize the elaboration process and the eventuality of mistakes in the correspondences.
Considering that the data processor does not reason on lines and points, but rather on the discontinuity and correspondence between the attributes of the numeric matrix, it is evident how a difficult quantitative comparison compensates the punctuality of the calibration that generically imposes a sequential reading. From the feedback attained from each pair of images is valued the epipolar geometry, whose reliability is guaranteed from a request of triple correspondence: the points of at least three frames are going to be valued, and from this it is evident that there is a need of a minimum of six images in order to create the pixel cloud. Less reliable results are then dismissed through static algorithms, optimizing the results of the correspondence and the radial distortions whose deviation and variation are going to be put on record, a similar method which is then evaluated and is also the graphic attribute of the point.
Once the processed files are sent back to the user, MeshLab can be used to create and manage the pixel cloud. Its construction is consequential to the assigning of fundamental parameters that have the function to interpret the measured data. In particular, the first required parameter is the subsample, the reduction of the output number of pixels: increasing the value, the definition of the points of the model decreases, a variation that can still guarantee a better result. A second fundamental parameter is the minimum count, the correspondence between elements: it is about identifying how many images are needed for the program in order to find its estimated point and to accept its value. This parameter is closely tied to one of MeshLab's strengths, its graphic fruition: in the first software interface each loaded image is associated with a gradually colored scheme based on the correspondence between points. These images have to be used also to calculate the texture of the model. Moreover, it is possible to design a mask for each of these images with the task to deselect and eliminate the parts of the images that are not relevant for the survey.
Further parameters have the outlier management and noise management task, that is, they have the duty to manage the deviations and the noise inherent to the images and, therefore, of each numeric model generated. These errors are bound to the intrinsic characteristics of the measurement's tools, or else digital cameras, regarding the deformations of the optics, and to extrinsic elements due to the surrounding conditions, regarding the unevenness of the light and of the material's propriety. In order to optimize them before the cloud's points are calculated, it is possible to carry out a series of operations in order to determine the following parameters: with the minim angle it is possible to set the accepted angle among the mesh, dismissing the elements with the most acute angles; with remove pieces less then it is possible to apply a filter that eliminates scattered pieces produced by the noise, with close holes less then it is possible to close all those open areas of the model whose distance from the others is less than a determined number of pixels; with feature aware smoothing it is possible to smooth the mesh; imposing a dilation and an erosion, something similar to a one-dimensional smoothing, it is possible to interpolate the estimated points with a better uniformity; with fast merge it is possible to quickly recreate the border; with scaling factor it is possible to globally reduce the model.
After having set the required models, the software generates the pixel cloud. Several attempts are usually required, nevertheless the interpolation of the mesh will inevitably be imperfect, with cones of shadow or some other mistakes due to the setting of parameters as well as to the automated choice of the points selected. The second phase consists in the management of the created model, duly modifying the mesh and applying a series of general filters. The problem of numerical modeling is tied to the capacity of selection of the points of the cloud, sometimes made of millions of elements. Fundamentally it is a cleaning process, a process of analysis and smoothing of the data, to make with carefulness in order not to lose any information and compromise the reading of the data.
For a correct methodological framework, it is important to linger on the next employment of the data attained with these techniques. The automation of the process brings to a numeric model that, first of all, has to be duly managed and verified. Once this cloud of pixels is created, it is possible to make use of it with different approaches: it is possible to see the digital data as complex and accurate set of space measurements from which is possible to get significant elements for a geometric interpretation, or it is possible to interpolate the points with a mesh, maybe integrating it in a differently elaborated geometric survey. The choice is closely bound to the analyzed object and to the goals of the survey, considering that the interpolation of the mesh creates a clone of reality unknown as reality itself, a condition that has to be clearly explicated in the design choices of the survey program. Although only in particular circumstances, as for example in case of sculptural details, it is convenient to focus on the appearance of the shape in order to avoid an unlikely geometrical interpretation. The operations of management of the model, in relation to the goals given by the scientific survey, have to be mainly punctual, ready to guarantee the accuracy of the estimated measurement, even at the expense of a severe finishing work.
The reliability of the data becomes then the heart of the matter. Therefore, if in the representative area there is still debate, to narrow the scope of this technique in the detection of architecture is necessary to establish criteria for correlate accuracy ensured with the scale of survey. In front of this aim, the first rule can be extrapolated from the representation of the minimal element, in this case the pixels. We can establish that the accuracy of the survey must be smaller than the graphics error and this is as the canonical thickness of the sign, ± 0.1mm. This rule imposes the maximum admissible error and, consequentially, it is possible to obtain the scale of the survey. The guaranteed maximum detail is, in fact, determined by the ratio between the size of the detected object and the number of pixel. In this way, only the generative images are bound and not the whole system of photomodelling operations performed by the model, purely probabilistic and, therefore, inevitably marked by the average estimates. It also doesn’t consider intrinsic errors of the instruments due to the deformation of the lens, to the different focus and in general the influence of the surrounding environment, a basilar element able to affect the quality of the image. These situations imply to impose a safety factor: it could be proposed a value of σA = 4, a reduction that will greatly restrict its use is inverting the reliability criteria used in photogrammetry. For example, in an image of 8 megapixel (3455x2303 pixel) that’s represent an object 3.00x2.00 meter, supposing a complete use of photo and considering, as safety factor, the dimension most foreshorten, one pixel draws a millimeter, that, in front of admissible error, established a good result for a scale 1:5.
In front of this, it is possible to propose another criterion, more experimental: it is obtained by marking the factors affecting the different phases and able to evaluate not only the single image, but the whole process of modeling. A different and more accurate value of the safety factor could be obtained considering the individual elements that affect the process, a σB as Σσi. Assuming a correct methodology of survey and acceptable conditions of the outline, the factors affecting the measure could be explicated so:
σ1 = 1.5 = probability factor intrinsic to the process;
σ2 = 0-2 = parameter depending on the lighting conditions;
σ3 = 0-2 = parameter depending to the material reflectance;
σ4 = 0-1 = parameter depending on the deformation and the type of lens / camera;
σ5 = 0-1 = parameter depending of accessibility (if you can move 180° around the object);
σ6 = 0-1 = parameter depending on the internal or external position;
σ7 = 0-2 = parameter depending in the evenness of the model
It is important to reiterate that the purpose of the criterion is to value by self-assessment the applicability of the model in the different case. This is a reference more than a rule, leaving the operator in the margins of interpretation, always a central characteristic in the architectural survey.
In conclusion, the study shows the limits of the photomodelling with free software that appear primarily as a technique able to integrate the operations of detection with excellent results. It’s aligned with the traditional practice of architectural survey, always marked by a precise choice of instrumental solutions depending on the aim and on the object analyzed. When other techniques certainly more reliable, as the laser scanning, are in crisis or when the heterogeneity of details leads to finding solutions of surveying easer, if the boundary conditions guarantee a correct process of implementation, the photomodelling will become a valid alternative and a great integration tool.
In front of this, the optimum scale of this process is maybe the architectural detail, where the point cloud resolves the difficulties of the formal complexity of punctual solutions. The ambient light conditions must always be valued and the consequential problems associated in particular to the reflectance, cause of automated matching between frames. Finally, it could be emphasized the relationship between accuracy and accessibility: in proportion to the proximity of the observer it is possible to get a point cloud more reliable with fewer noise and deviation errors.
The practice and the experience play a basilar role in the final result. The complexity of the process points out that the numerical mode is not quite a simple action design and maybe is more difficult than the geometrical model. At the base there is always a process of interpretation: the choices, although they only partially affect the shots, become decisive in the creation of the cloud and in the finishing touches, where the risk of measure altering was marked, the same is present in all the operation surveys.
Compared to similar programs, the free software, the object of this dissertation, requires a very important statistical interpretation whose reliability is confirmed by the results, by models that were set up by hundreds of thousands of points. Also if math questions, fundamentals of software functionality, is not the task of the surveyor, understanding the logic used, especially with the assistance of the experience, leads to trust and hope on using this technique.
The proper question is not whether the photomodelling is useful for the scientific survey, but when it is appropriated to adopt this technique, and what and how it is possible to obtain from this technology. If those applications are most successful among experts of computer graphics rather than from the surveyor themselves, perhaps it is not because they don’t confide in the procedural system, but in front of the more difficult control of the instrument of interpretation, no longer the line, but the mathematical statistics. And line is graphically easier to manipulate and verify rather than mathematical formula.
In conclusion, it could be interesting to explain the results of the photomodelling applications with examples. These are derived from a first person study in Borromini’s Sant’Ivo alla Sapienza, inside an excerpt of PhD Science of Representation of Sapienza Università di Roma, and from the subsequent activity of tutor in Technique of representation (prof. Fabio Bianconi, a.a. 2009-10) in University of Perugia.
As first image, here it could be useful to show the points cloud created by MeshLab with data and frames elaborated by ARC3D: just only in the number of pixel and in the quality of details it is possible to intuit the photomodelling potential. The Figure 1 represents a detail of Sant’Ivo’s cloister, it is not a mesh model, but every point is a pixel with a color. It appears however discontinuous, with holes, a condition that will create problems in the creation of triangulated mesh model and will be resolved only after a meticulous and punctual digital action.
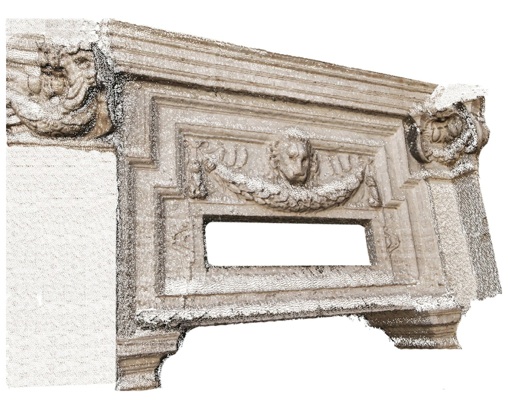
Figure 1 _ Detail in Sant’Ivo alla Sapienza’s cloister: pixels cloud created by MeshLab and Arc3D (Marco Filippucci).
The Figure 2 is a model with a perfect texture is not always the best results: in fact, also if the effect is a good simulation of the real object, in this image is hidden a vague model, with a lot of errors. Particularly, if the model is rotated, it will be possible to see all the overshadowing and all the errors of interpretation automatically generated from the software to connect the points. But it is not an irremediable deformation: here it is possible to resolve all the imperfections with a punctual elaboration, deleting the wrong mesh and recreating a correct configuration. This figure shows also a noise in the part of the model that represent uniform surface, where instead the digital model appears confused and irregular. Really it is not an insurmountable problem because it is very simple to integrate a geometric model in the numeric one. This fact explained, however, a basilar rule: the real target of numeric modeling must be a sculptural object, an element where the interpretation of geometry isn’t useful.
Figure 2 _ Detail in Sant’Ivo alla Sapienza’s cloister: final elaboration model and visualization of 3d Mesh object with texture in MeshLab (Marco Filippucci).
The Figure 3 shows as a good model can offer also an accurate detail. Here it is possible to show the digital process too, as the software choice particularly images and elaborates them with digital a filter that can mark a selected prerogative of the object of study, facilitating comparison.
The next images are the result of tutor experience.
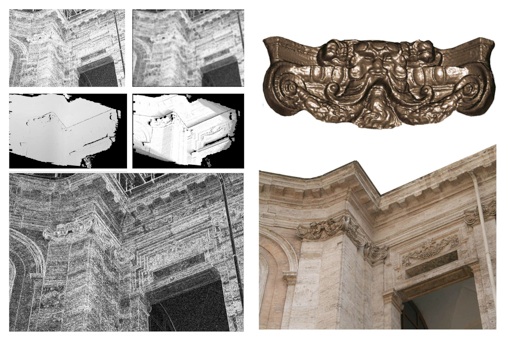
Figure 3 _ Detail in Sant’Ivo alla Sapienza’s cloister: ARC3D’s filters and final elaboration model (Marco Filippucci).
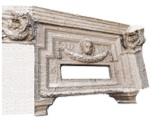
In Figure 4, Eugenio Bini, representing the lion mural panel in Perugia’s Palazzo Cesaroni, had worked with a numeric model with smoothing filters that had created a very good model.
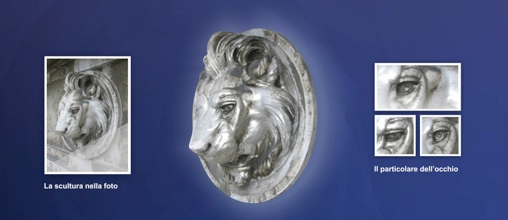
Figure 4 _ Lion mural panel in Perugia’s Palazzo Cesaroni (Eugenio Bini, course of Technique of Representation, University of Study of Perugia, a.a. 2009-10).
In Figure 5, Stefano Antoniacci had chosen to study the bracket under the Perugia Cathedral’s pulpit, a very appropriate object, all in shadow, without reflections, accessible 180° and with a great chromatic and morphologic variation.
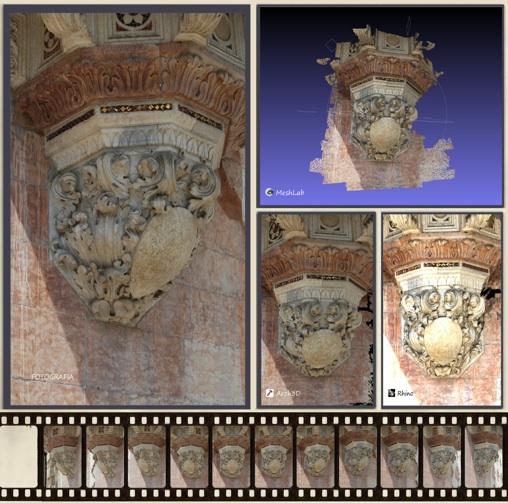
Figure 5 _ Perugia Cathedral’s pulpit (Stefano Antoniacci, course of Technique of Representation, University of Study of Perugia, a.a. 2009-10).
In Figure 6 is represented an historical portal of a palace in Perugia. Carmen Somoghi had worked hard on this mesh model, but maybe in the image, due to texture’s mask, hides the action of cleaning and the punctual analysis effectuated from the original result of MeshLab (in the right) and the successive operation in the mesh model (in the left).
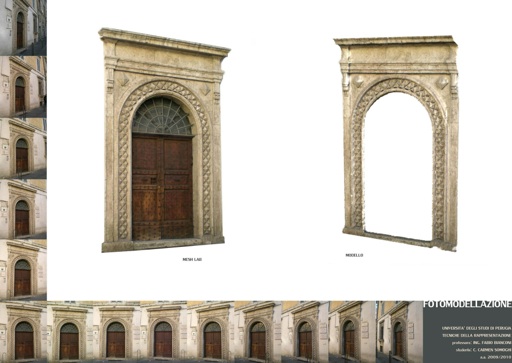
Figure 6 _ Historical portal of the ex Sorbello Palace in Perugia (Carmen Somoghi, course of Technique of Representation, University of Study of Perugia, a.a. 2009-10).
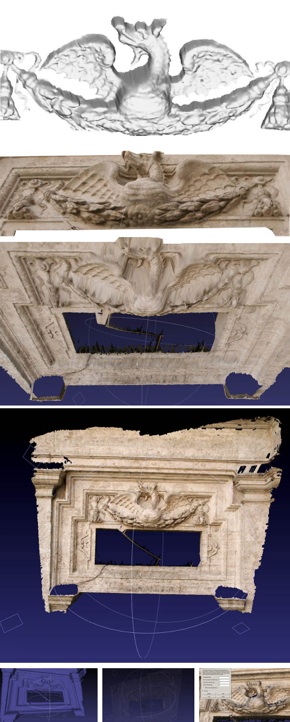
The last work presented in Figure 7 is from Gabriele Rinchi and it’s about the portal of Collegio del Cambio in Perugia. It shows a different approach with photomodelling data: for different reasons, the point cloud is confused and incomplete, so it may be impossible to resolve all the errors. But the photomodelling process can guarantee in determinate portion of virtual objects a correct measure: it is just in three-dimensional space and so the survey became a fast action where the geometric interpretation recovered its principal role of instrument of knowledge, and photomodelling, finally, appeared in relationship with the architectural survey targets.
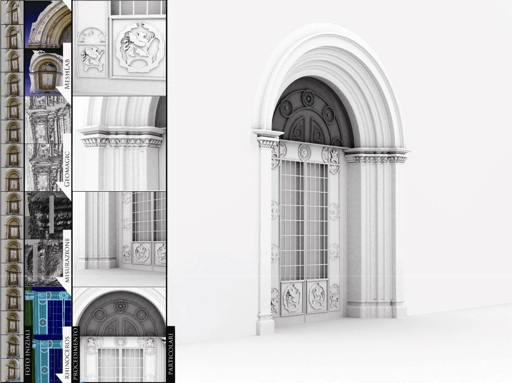
Figure 7 _ Model of the portal of Collegio del Cambio in Perugia (Gabriele Rinchi, course of Technique of Representation, University of Study of Perugia, a.a. 2009-10).
REFERENCES
GM. Callieri, P. Cignoni, M. Dellepiane, G. Ranzuglia, R. Scopigno, Processing a Complex Architectural Sampling with MeshLab: the case of Piazza Della Signoria, Proceedings of 3D-ARCH 2011, in vcg.isti.cnr.it.
P. Cignoni, M. Callieri, M. Corsini, M. Dellepiane, F. Ganovelli, G.Ranzuglia, MeshLab: an open-source mesh processing tool, in EG It 2008, Scarano, R. De Chiara, U. Erra (eds.), Proceedings of Eurographics Italian Chapter Conference (Salerno, 2-4 July 2008), Eurographics Association, 2008.
L. De Luca, Architectural Image-Based surveying, modeling and representation. Methodological reflections and research tracks, in www.map.archi.fr.
L. De Luca, La fotomodellazione architettonica, Flaccovio Dario, Palermo 2011.
M. Docci, D. Maestri, Manuale di Rilevamento architettonico e Urbano, Laterza, Roma-Bari 1994.
M. Filippucci, Nuvole di pixel. La fotomodellazione con software liberi per il rilievo d’architettura, in “DisegnareCon”, 2 (2010) (disegnarecon.cib.unibo.it).
M. Thompson, H. Gruner, Foundations of Photogrammetry, Manual of Photogrammetry, American Society of Photogrammetry, Falls Church, Virginia 1980.
M. Vergauwen, L. Van Gool, Web-based 3D reconstruction service, in “Machine Vision and Applications”, 17 (2006).
Drawing and surveying with pixels
Photomodelling with free softwares for an architectural survey
Marco Filippucci
Università di Roma “La Sapienza”
e-mail: mfilippucci@hotmail.com

This paper analyzes photomodelling technique with the aim of understanding its basic logic, but always through a practical approach, useful for an architectural target. Really the revolution of photomodelling is particularly explicit in a comparison of the cost of the instruments, the inaccessible laser scanners on one hand, and the common digital cameras on the other hand. Furthermore, international research organizations have developed open source software that allows the creation of the numerical model and the elaboration of the point cloud. Based on personal research experiences and later on the teaching support, the aim of the study is to analyze the logic of these processes, to verify its applicability in the field of architectural research, making a useful way to understand the computer procedures and to determine criteria for evaluation of their reliability.