1. INTRODUCTION
1.1Post-processualism and its implications for archaeological data representation
The post-processualist movement emerged in the 1980s as a critical response to what its advocates felt was the overly scientific, positivist and ‘ahumanist’ perspective of the New Archaeology school of thought (Trigger 1996, pp.444-78; Hodder & Hutson 2003, pp.206-35). The post-processualists, who are by definition much more fragmented as a group than any of the previous archaeological schools, can nonetheless be loosely characterised by a philosophy of thinking that broadly follows the self-critique of postmodernism. To emphasise this plurality of opinion and approach, Ian Hodder prefers to refer to the movement as being a collection of ‘interpretive archaeologies’ (Hodder et al. 1995, p.5).
Therefore, when operating in the post-processualist philosophical environment we are immediately presented with a potentially limitless range of possibilities in which to engage with archaeological research and in which to disseminate or present interpretation. While Hodder and most other post-processualists would reject the temptations of adopting open relativism, the framework does nonetheless promote the ideal that all interpretation is contextually produced and to a certain extent all interpretation is therefore valid (Hodder 2003, 234).
How does this realisation affect the ways in which archaeological data can and should be stored, manipulated and visualised? To date, traditional representational media such as text, graphical imagery and tabular visualisations have adequately serviced the needs of the positivists. These media have generally appeared in print and this has reinforced one of the primary principles of New Archaeology, namely that an objective truth can be empirically observed and obtained (Tilley 2004, p.11). The ambiguity or, as Hodder would say, the ‘multivocality’, of the post-processualist paradigm is left short-changed by this representational environment. The printed word and image make the representation of doubt and nuanced opinion difficult (Moser 2001). While it would be untrue to claim that their rendering is impossible, any additional wish to engage the audience with the interpretation in real-time is undoubtedly denied within the printed media form.
1.2 Other project motivations and the history of the research
This project began life as the subject of the author’s final year undergraduate dissertation thesis which he carried out within the Classics department of Trinity College Dublin in the academic year 2009-10 (Lynam 2010). The original project focussed for the most part on the representational side of what is covered in this paper and therefore much of what follows relies heavily on this period of study.
Besides the concerns that were raised in the previous section, one other major motivational factor has driven this research. From the first days of working on-site as a field archaeologist, it was abundantly clear to this author that the sector suffered from an extreme knowledge deficit in the area of IT, especially in its use as a tool for data management. Different projects tend to adopt different data management policies and practices that more often than not are mutually incompatible. Often projects do not even have a set of digital data expectations or if they do, a single staff laptop and an external hard-drive are deemed sufficient to meet it. These data policies are largely decided in a random and idiosyncratic way, based on the wishes of the project’s directors and leading decision makers. The end result is of an archaeological discipline cast adrift in a sea of incompatible datasets, many of which are not even available as digital copy.
In summary, archaeology lacks at a monumental scale a standard for the management of its digital data record. Recalling the words of Mortimer Wheeler, that ‘excavation is destruction’ (Wheeler 1956, p.15), the idea that we, as its practitioners, would carry out this destruction without putting the majority of our efforts into the careful and thorough documentation and storage of this process, verges on the immoral. If nothing else then, this paper will hopefully act as a call for the adoption of a universal standard for the management of archaeological digital data. Admittedly this will be a highly difficult process but we should consider that its resolution is exponentially more preferable to the potential consequences of continuing as we currently do.
1.3 Project goals and approaches
With the two core motivational philosophies in place (i.e. to accommodate post-processualist ideologies and to standardise the process of data collection, storage and dissemination) a general blueprint was needed before the work could begin.
Firstly, any possible solution had to be economically viable. Archaeological projects are typically financially challenged and so any solution needed to be cognizant of this fact. An obvious starting point was then to select potential tools on the basis of their availability from the open-source community. Or, if not being explicitly open-source, then the project would target those solutions that were available at vastly reduced pricings through the avenue of educational selling. Happily, this latter type of offering is becoming more popular among the major software giants with Microsoft and Adobe leading the way.
The second major consideration was scale. For a project that was initially envisaged as a 5-month undergraduate thesis, it was of paramount importance to formulate a blue-print that was achievable within the timeframe.
In terms of features, the solution needed to emphasise the principles of collaboration. As with most technologies these days, this implied an Internet delivery. The solution also needed a data management architecture that could accommodate the enormous quantities of data that modern archaeological sites can and should be producing. This data management platform also needed to be able to accommodate multiple parallel data connections in order to allow the system to be simultaneously accessed by a large audience-base.
Finally, the eventual solution was to be disseminated freely to the public and more specifically to the archaeological community who would act as its initial knowledge producers. Any solution that hoped to address the issue of standardisation within archaeology needed to be adopted by that community. It was hoped that by providing the solution at no cost as an online download and by promoting the establishment of an ArcSeer/ArcRange community of users, that the advantages of using the standard would become evident and that its long-term user-base would grow.
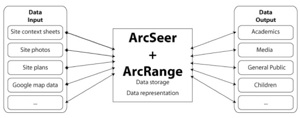
Figure 1: The ArcSeer/ArcRange knowledge bridge
2 . ARCRANGE
2.1 The varied forms of archaeological data
Modern archaeological projects produce data of numerous varieties (Schloen 2001). As the range of methods that are used to retrieve data from the archaeological record has increased so too have the ways in which these data are represented (Renfrew & Bahn 2008). Despite this rapid increase in types of data, their representation and digital form are finite and can be briefly listed here.
2.1.1 Text
The most common representational form is still the most fundamental and effective way in which we can present interpretation. As we will see, text suffers less from the problems that afflict the other forms of data representation as it deals significantly better with the presentation of doubt and multiple interpretation by presenting different tones or registers of language to the user, aspects that lend themselves extremely well to post-processualist ways of thinking. In fact, language itself, in all of its complexity and nuanced character, and the hermeneutics of language can quite legitimately be associated with the origins of all postmodernist thought.
Text is an ideal data type to be used in an online database system as it leaves a small memory footprint and generic text fields can be used to represent numerous types of information (e.g. metrics, descriptive passages, object types, etc.).
2.1.2 Graphical representations
Graphical representations can take various forms: photographic reproductions, scanned plans, sections, elevation drawings, special find profiles, orthographic and isometric reconstructions, graphs, charts, etc. They have always played a role in the representation of archaeological data from the discipline’s nascent antiquarian beginnings and today the situation is no different. While powerful in the sense that they can quickly deliver an interpretation that would otherwise be more slowly withdrawn from a textual account, it is precisely this that can make them somewhat problematic when used in the post-processualist paradigm. Stephanie Moser has contributed much to this debate (Moser 2001; Moser 2006) and much of her critique could be applied equally to the use of all forms of representation. Ironically, it is often the advocates of post-processualism that make most use of the more subjective or imaginative styles of reconstructive art, heralding it as a way of moving closer to the oft-neglected human agent in the archaeological study of the past.
Graphical representations in digital forms have recently become dominated by the JPEG standard which allows users to select quality over file-size and vice versa. There are other file-types in use too (e.g. the PNG and GIF which provide transparency support and the BMP and RAW which can ensure no quality loss due to compression) but for the most part the JPEG provides the majority of image storage functionality that any archaeological project would need. Its integration into the more standard database architectures (e.g. MySQL and MS SQL Server) is less straightforward, however, and it is often preferable to store JPEGs as files within file systems which is the approach taken by ArcRange.
2.1.3 Tabular
Tabular data is used as a common method of displaying large amounts of related information. For example, the results of a palynological survey might best be represented in a table in which specific pollen types are correlated against their concentrations at various different core levels as seen in a survey of the Trolinger Spring site in Missouri by James King (Figure 2).
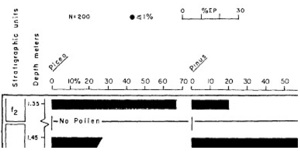
Figure 2: Example of a palynological dataset represented using a tabular form (King 1973, fig.10)
Tabular data can be treated as similar to textual data when considering its use in a database with the added caveat that an additional level of display logic be required to convert the database native types into the final tabular representation.
2.2 System blueprint and implementation
The first task of the project was to accommodate the various forms of archaeological data within an online enterprise-scale environment. This subsystem was to become ArcRange and it was built on a stable platform of standardised technologies that have become synonymous with Internet data application services over the past decade.
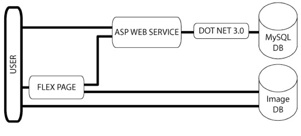
Figure 3: ArcRange component diagram
The beating heart of ArcRange is the database component which is in the form of a MySQL Community Server (Oracle Corporation 2010). This open-source GPL platform is freely available for download and can more than adequately support even the largest archaeological project’s data management needs.
The ArcRange database is made available to online users through both an Adobe Flex web page interface and an ASP Web Service interface which reside on the same physical server as the MySQL server. The presence of both service types potentially affords a broad range of devices (e.g. Windows computers, MACs, iPhones, iPads and Android devices) access to the data in the database. The Adobe Flex web page provides a high quality user interface design that is less easy to obtain when using other technologies such as PHP.
Finally the operating system within which all the above servers run is Windows Server 2003 which is hosted online as a VPS, a relatively new Internet hosting innovation which builds on the cloud-computing paradigm providing local-style access and control of online resources through the use of remote desktop control software (Rhoton 2010).
The MySQL design is based on the relational database model (Fleming & Halle 1989). It contains a number of tables which cross-reference each other, each representing the major data categories which make up a single project’s dataset (e.g. contexts, catalogued objects, finds, etc.). A schematic showing the tables and their inter-relation is shown in Figure 4 (e.g. the Contexts table is linked to the Catalogue-Ceramics table, the Catalogue-Fauna table and so on).
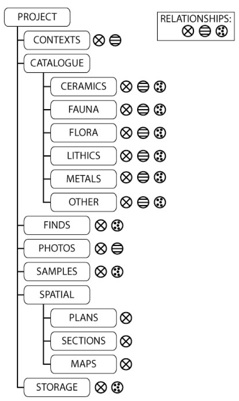
Figure 4: The ArcRange MySQL database structure
3. ARCSEER
3.1 A brief word on phenomenology
Phenomenology’s use by archaeologists falls very much within the discussion of post-processualism when considered at an epistemological level (Trigger 1996, pp.472-3). It has been championed by such figures as Christopher Tilley (Tilley 2004) and Tim Ingold (Ingold 2000) who both believe that the philosophy’s teachings, (as particularly outlined by Edmund Husserl (Husserl & Dermot Moran 2001; Husserl et al. 2001) and critiqued and modified by his successors, including Merleau-Ponty (Merleau-Ponty 1967)) are very well suited to creating a more humanistic interpretation of past cultural activity.
Taken together, Tilley and Ingold advocate the value of a number of the core principles espoused by the phenomenologists. They feel that the mind-body, objective-subjective and natural-cultural dichotomies are not helpful models with which to think about landscape (Tilley 2004, p.24; Ingold 2000, p.169). They also share the view that ‘inanimate’ objects gain a sort of agency because of their ability to affect humans (Tilley 2004, p.18). The Renaissance view of landscape as a fixed window of observation is, they feel, a deeply flawed and indeed potentially dangerous understanding. Finally, and perhaps most importantly of all, they no longer see landscape as being divorced from the observer or the body (Tilley 2004, p.17). These approaches are in the view of Ingold and Tilley an ideal starting point with which to engage with material culture.
Tilley laments the fact that landscape archaeologists have traditionally conducted their research in an atmosphere that is utterly divorced from their subject matter – ‘bodies remain at the desk rather than in the field’ as he puts it (Tilley 2004, p.27). He goes on to voice his discomfort with the ways in which landscape is represented to the knowledge consumer (Tilley 2004, p.28). He advocates the use of a language register that more closely tracks the feelings of the archaeologist as he or she engages with a landscape, as and when it happens. As we have already noted, the textual media is the best suited of the traditional representational canon to achieve this type of flexibility of interpretation and Tilley notes this potential (Tilley 2004, pp.28-9).
This paper would argue however that new technologies or, more specifically, new representational media offer much more potential in the rendering of phenomenological points of view with respect to all archaeological data types and it is with this in mind that we will continue our discussion with a description of the ArcSeer visualisation tool.
3.2 Towards a phenomenology of data representation
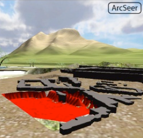
The ArcSeer system was designed as a visualisation tool for modern archaeological projects that could accommodate the sorts of archaeologies that were espoused by the post-processualists, especially those interested in the phenomenological approach. When a user first logs into an ArcSeer project, he is immediately conscious that his virtual self exists within a 3D environment in which user and data interaction occurs (see Figure 5).
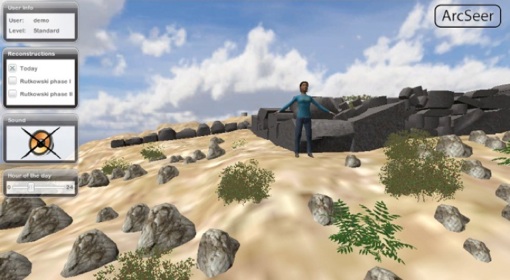
Figure 5: The ArcSeer environment
While the use of 3D can often fall into the trap of being an end in itself, ArcSeer’s 3D functionality was chosen because of its suitability as a means of presenting data and interpretation to the user in a more naturalistic way which is a fundamental of a phenomenological archaeology. Users are no longer presented with data using the abstraction employed by traditional media that we have come to accept without question. Gone are the rows and columns of tables that so often constitute how the archaeologist presents his version of reality to the audience. These are replaced with a representation that more closely resembles a naturally perceived experience of the actual data. For example, if the user is interested in a particular building at a site, he or she moves through virtual space to that building in order to engage with the data.
It is important to point out that the 3D graphics employed to render an ArcSeer project are not hyper-realistic. In fact, one might even go so far as to call them simplistic or naive. This is an intentional feature. The use of hyper-realism in 3D has the danger of (knowingly or otherwise) tricking the perceiver into thinking that the representation is in somehow ‘real’ or, in other words, that it has a greater ‘truth’ value than another interpretation (cf. Moser’s ‘authenticity’ concern (Moser 2001, pp.273-6)). ArcSeer’s 3D visualisations verge on the cartoonish and they do this to constantly emphasise the fact that all the representations of reality included are products of interpretation whose subsequent consumption is also an interpretative act.
3.3 System blueprint and implementation
At the practical nuts-and-bolts level ArcSeer projects are developed using a number of tools that offer compatible yet different facilities. The primary 3D engine is built using Unity3D (Unity Technologies 2011), a games development platform which boasts Internet, Windows, MAC, smart phone and games console export facilities. Unity3D was chosen for a number of reasons, the first being this ability to provide web applications. The second was its availability as a free download that retained enough of its professional functionality to meet the requirements of the project. The third reason was its support for the importing of 3D objects designed in 3D modelling suites such as Autodesk’s 3ds Max and Maya (Autodesk 2011) and Google’s SketchUp (Google 2011). Finally Unity3D’s support for scripts written in either JavaScript or C# confirmed it as the most attractive of the platforms on offer. For the sake of brevity the following description of the design process will not go into significant detail.
Firstly, a core set of modules were written for Unity3D in a combination of JavaScript and C#. These modules provided the basic user interface for ArcSeer (login screens, 2D interface items on the main screen), 3D navigation logic and interfaces for the accessing of online data resources – links to ArcRange and other online resources.
One of the key philosophies of ArcSeer, which again stems from phenomenological teaching, was the principle that all archaeological sites cannot exist or indeed be understood if they are divorced from their surroundings. Therefore, ArcSeer projects needed to include a fairly large (on average c10x10km real-world area) landscape component in their design. In order to achieve this, a Digital Elevation Map (DEM) for the target area was imported into Unity3D. Thus far, it has been impossible to obtain adequate DEMs for all except one of the ArcSeer projects created. It was therefore necessary to manually produce the DEMs using traditional print contour maps as a guide. This process was found to be both laborious and time consuming but its results always vastly out-performed the resolutions provided by online DEM sources (see the CGIAR-SCI plugin for Google Earth as an example (CGIAR 2010)).
With the landscape in place, it was then necessary to shift the focus to the actual archaeological site in question. The first task was to create a 3D model of the extent remains. This required access to adequate site plans, photos, etc. For the most part, the fine level of detail required for this stage was best obtained using a combination of the Adobe range of image manipulation software applications and Autodesk’s 3D renderer, 3ds Max.
Depending on the project, additional layers of 3D information could then be included. These layers can be turned on or off within the user interface. One example of a layer type is the architectural reconstruction which can be associated with a particular period of a site’s occupation. These reconstructions, along with the landscape renditions, the extent remains and all the other elements that make up an ArcSeer project are constructs derived from a process of interpretation and the user is constantly reminded of this fact.
The next step was to identify each of the elements in the scene that might have additional data associated with them. By assigning constructs such as walls or surfaces identifiers, these can then be correlated with local and online data resources in order to create the system’s data network. From the user’s perspective, this means that by clicking on a wall of interest a popup dialog is presented which includes information derived from the online ArcRange resource.
Finally it is worth noting some of the more atmospheric features that ArcSeer provides. When the user looks up he or she can see the sun making its way slowly (albeit at a faster rate than in real-time) across the sky. When the sun reaches the western horizon, night falls and the environment is plunged into darkness. The user is free to experience the site and its environs in this new context. The user is also able to turn on the ArcSeer audio. The user will immediately hear the call of the birds in the air or the howl of the wind if located on an exposed mountain side. The user is able to wander about the landscape, free from the constraints that are so often placed on movement (and by inference, experience) that other 3D visualisation solutions impose. This final set of features was developed in an effort to break down the mind-body-external environment dichotomies.
4. COMBINED OPERATION
4.1 The ArcRange and ArcSeer conversation
While ArcSeer runs in the user’s memory space, it derives the majority of its data from either online file servers (as in the case with the UNITY3D world files) or ArcRange resources. As ArcRange was designed with cross-platform connectivity in mind, this process is relatively straightforward with ArcSeer making calls to ArcRange’s ASP Web Service thereby providing it with indirect access to the MySQL database. The entire network is summarised in Figure 6.
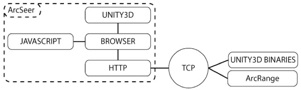
Figure 6: The ArcSeer/ArcRange data network
5. CASE STUDIES
5.1 Petsofa
Petsofa has been classified as a Minoan peak sanctuary, a particular type of religious site that saw prominence in the Middle to Late Minoan (c2100-1050BCE) period (Dickinson 1994, pp.266-71). The site was excavated by Sir John Myres in 1903 and despite the dig lasting only two days its publication remains one of the seminal works on the subject (Bosanquet et al. 1902, pp.356-387). Myres identified two major phases with the early phase being associated with the transhumance culture that is thought to have dominated rural Crete during the Early Minoan period (Dickinson 1994, p.36). In reflection of this humble beginning, the site at this period was relatively simple in form with a series of conjoined and tiered terraces making up the core of the architectural components. The second occupational period at Petsofa was interpreted to be much more elaborate and wealthy in character and scholars speculate that this signals the monopolisation and centralisation of rural cult by the urban centres, particularly Knossos (Peatfield 1983, p.273). As you can see from the screenshot in Figure 7, the reconstruction proffered for this period reflects this exuberance of style (note that an isometric drawing completed by Rutkowski and Nowicki was used as a guide for this ArcSeer model (Rutkowski 1988)).
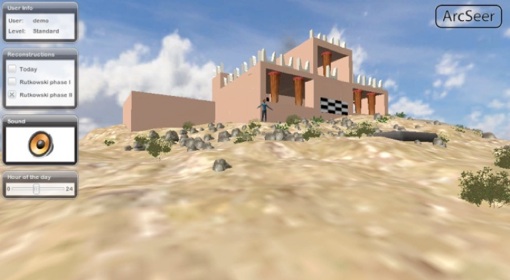
Figure 7: Reconstruction layer turned on in the ArcSeer Petsofa project
Petsofa was the first site to be rendered using the ArcSeer/ArcRange paradigm and as such many of the difficulties and insights encountered during its development helped guide the design of the overall system. As this author has visited the site on a number of occasions (as well as at different times of the year), it seemed fundamental that something of the atmospherics encountered on these trips be included in the ArcSeer environment. This drove the addition of sound effects and the general acceptance that a site had to be understood in the context of its wider surroundings (see Figure 8 and Figure 9). Perhaps at no other site type than the Minoan peak sanctuary is this realisation found to be more compelling.
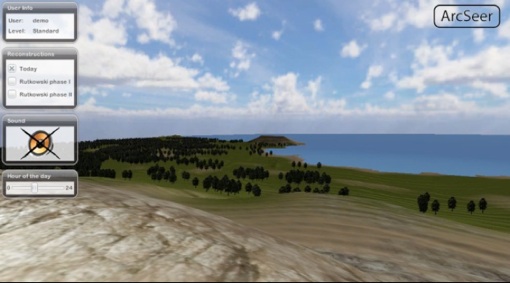
Figure 8: Surrounding landscape in the ArcSeer Petsofa project
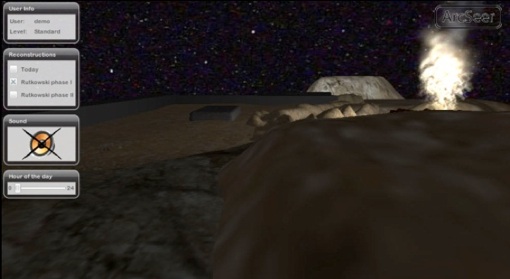
Figure 9: Night-time scene in the ArcSeer Petsofa project
5.2 Priniatikos Pyrgos
Priniatikos Pyrgos (PP) is a multi-period headland site showing evidence of residential, religious and industrial activity (Molloy 2011). A pioneer of Cretan prehistoric studies, Edith Hall, sunk a number of test trenches in the area in the early 20th century. This exploratory work was followed up after a significant hiatus in the 1980s when the University of Pennsylvania Museum initiated the Vrokastro Survey Project, an undertaking which was coordinated by Barbara Hayden (Hayden 2003). In 2007 the project’s management passed over to the Irish Institute of Hellenic Studies at Athens under the stewardship of Barry Molloy. It was in this latest incarnation that this author first came into contact with the project and has since then worked as its IT coordinator. A substantial portion of the details and motivations involved in the technical and philosophical thinking behind this paper can be credited to this time.
The creation of an ArcSeer/ArcRange project for PP was informative as to a large extent the system by that stage had reached a fairly stable and satisfactory level of performance and thus while the Petsofa project was carried out very much within a ‘proof of concept’ mould, the work with the PP dataset allowed the system to be field-tested as a fully working solution.
Once again the resolution of available DEM data for the region proved to be inadequate and so a custom DEM of the area had to be created using regional print contour maps. An added incentive for creating an ArcSeer/ArcRange solution for PP was the project’s progressive attitude towards digital archiving and as a result large amounts of data had already been committed to disk. While the project stores this data in a FileMaker Pro database, it was successfully managed to export all relevant data and convert it to the ArcRange format before transferring it to the ArcRange MySQL database.
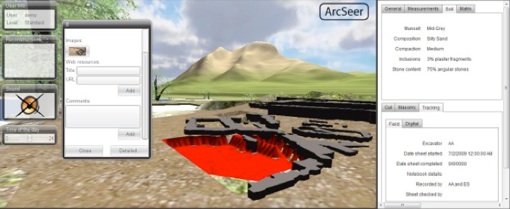
Figure 10: Accessing online ArcRange data resources in the ArcSeer Priniatikos Pyrgos project
6. CONCLUSIONS
6.1 Summary of project research and findings
This paper proposes that modern archaeological interpretation can no longer be adequately serviced by the traditional representational toolkit. It is argued that postmodern styles of reasoning which now form a component of most, if not all, modern archaeologies suffer as a result of the stasis, dormancy and general one-dimensionality of the printed form. Digital solutions can potentially help find a way around this interpretive roadblock with technologies such as interactive 3D and Internet and database services offering new avenues of representation. This paper goes on to argue that these technologies are no longer the preserve of large corporative efforts in which time, expertise and finance deny their use by smaller groups that typically constitute the modern archaeological digital team.
By designing, implementing and making freely available the ArcSeer/ArcRange toolkit it is hoped that this research has shown that this ideal is realisable. ArcRange proves that providing standardised digital data archiving for the archaeological community is possible and worthwhile. ArcSeer has shown that 3D need not be an end in itself but it can be used as a tool to help bring post-processualist doubt, immediacy, multivocality, user interaction and general self-critique to a modern audience that has come to assume certain levels of information delivery by their knowledge producers that to date archaeology has failed to deliver on.
6.2 Future steps
There is still much work that can and will be attempted within the ArcSeer/ArcRange paradigm. By its definition, post-processualist archaeologies are varied and opinions and frameworks change organically over time and any system that is designed to store, manipulate and/or represent post-processualist knowledge must be prepared to change accordingly. By way of illustration, a brief, and by no means complete, list of potential future advancements for the system is given here:
6.2.1 Additional device support
Possible additions might include the iPad, iPhone and/or Android operating systems.
6.2.23D avatar addition
As with other online interactive 3D environments (such as Second Life), users could be afforded the opportunity of engaging with the 3D environment in the company of other online users who would be represented as 3D avatar figures who could be engaged with in real-time using chat and/or audio functionality.
6.2.3 Hierarchies of access
A tiered hierarchy of access was always envisaged as a feature for the solution but as yet it has not been introduced. This would mean that the system could be accessible by divergent audience groups (e.g. project team members, general public, academics) that have different interests and levels of knowledge and would in turn be afforded different user experiences.
7. ACKNOWLEDGEMENTS
This project could not have been completed without the assistance of a number of individuals. By far the most thanks must go to Christine Morris of the Department of Classics at Trinity College Dublin who supervised the initial research and who continues to provide valuable insight and direction. The author is also extremely grateful for the opportunities afforded him by the Priniatikos Pyrgos Project, especially by its director, Barry Molloy, an academic who has fully embraced the potential that new technology offers archaeology and who regardless of the difficulties involved has always endeavoured to encourage his staff to push the boundaries of existing practice. The author would finally like to thank all the staff at the Department of Classics in Trinity College Dublin and at the Department of Archaeology at Cambridge University for their continued support.
8. REFERENCES
Autodesk, 2011. 3D Design Software. Available at: http://www.autodesk.co.uk/ [Accessed January 23, 2011].
Bosanquet, R.C. et al., 1902. Excavations at Palaikastro. II. The Annual of the British School at Athens, 9, 274-387.
CGIAR, 2010. CGIAR-CSI. Available at: http://www.cgiar-csi.org/ [Accessed January 23, 2011].
Dickinson, O.T.P.K., 1994. The Aegean Bronze Age, Cambridge: Cambridge University Press.
Fleming, C.C. & Halle, B.V., 1989. Handbook of Relational Database Design, Addison-Wesley Professional.
Google, 2011. Google SketchUp. Available at: http://sketchup.google.com/ [Accessed January 23, 2011].
Hayden, B.J., 2003. Reports on the Vrokastro Area, Eastern Crete, University of Pennsylvania Museum Publications.
Hodder, I. et al. eds., 1995. Interpreting Archaeology: Finding Meaning in the Past 1st ed., Routledge.
Hodder, I. & Hutson, S., 2003. Reading the Past 3rd ed., Cambridge University Press.
Husserl, E. et al., 2001. Logical Investigations: v.2: Vol 2 New edition., Routledge.
Husserl, E. & Moran, D., 2001. Logical Investigations: v.1: Vol 1 New edition., Routledge.
Ingold, T., 2000. The Perception of the Environment: Essays in Livelihood, Dwelling and Skill 1st ed., Routledge.
King, J.E., 1973. Late Pleistocene palynology and biogeography of the Western Missouri Ozarks. Ecological Monographs, 43(4), 539-565.
Lynam, F., 2010. Petsofa: an Investigation into Archaeological Representation. Unpublished BA thesis, Trinity College Dublin.
Merleau-Ponty, M., 1967. Phenomenology of Perception, Routledge & Kegan Paul PLC.
Molloy, B., 2011. Priniatikos Pyrgos. Available at: http://www.priniatikos.net/ [Accessed January 23, 2011].
Moser, S., 2001. Archaeological representation: the visual conventions for constructing knowledge about the past. In Archaeological Theory Today. Cambridge: Polity Press, pp. 262-83.
Moser, S., 2006. Wondrous Curiosities: Ancient Egypt at the British Museum, Chicago, Ill: University of Chicago Press.
Oracle Corporation, 2010. MySQL :: Download MySQL Community Server. Available at: http://dev.mysql.com/downloads/mysql/ [Accessed January 22, 2011].
Peatfield, A.A.D., 1983. The topography of Minoan peak sanctuaries. The Annual of the British School at Athens, 78, 273-279.
Renfrew, C. & Bahn, P., 2008. Archaeology: Theories, Methods and Practice 5th ed., Thames & Hudson.
Rhoton, J., 2010. Cloud Computing Explained: Implementation Handbook for Enterprises 2nd ed., Recursive Press.
Rutkowski, B., 1988. Minoan peak sanctuaries: the topography and architecture. Aegaeum, 2, 71-100.
Schloen, J.D., 2001. Archaeological data models and web publication using XML. Computers and the Humanities, 35(2), 123-152.
Tilley, C., 2004. The Materiality of Stone: Explorations in Landscape Phenomenology, Berg Publishers.
Trigger, B.G., 1996. A History of Archaeological Thought 2nd ed., Cambridge University Press.
Unity Technologies, 2011. UNITY: Game Development Tool. Available at: http://unity3d.com/ [Accessed January 23, 2011].
Wheeler, M., 1956. Archaeology from the Earth, Penguin Books.
ARCRANGE AND ARCSEER: Presenting a New Approach to Archaeological Data Management and Representation
Young Author Award
3D-ARCH International Workshop, 2-5 March 2011, Trento, Italy
F.Lynam
Department of Archaeology, University of Cambridge, Downing Street, Cambridge CB2 3DZ, United Kingdom

This paper presents a new approach to archaeological data management and representation. The archaeological discipline has struggled to come to terms with the representational demands imposed by the adoption of post-processualist theoretical methodologies. The traditional canon of representational device that has served the positivist frameworks so well in the past has been found wanting when used to present post-processualism’s doubt, multivocality, multisensory experience and general reflexivity. This paper presents a new set of data management and visualisation digital tools that seek to address these shortcomings. ArcRange is a backend data management solution that provides easy and powerful manipulation of the varied forms that make up modern archaeological datasets. ArcSeer is a data visualisation tool which uses 3D technology to represent datasets in a more naturalistic or phenomenological way. ArcSeer accesses its data by interfacing with ArcRange. This paper will present an overview of the combined operation of both of these new systems using the test datasets of the Cretan sites of Petsofa and Priniatikos Pyrgos by way of illustration.
Keywords: 3D, visualisation, digital data, post-processualism, user collaboration, web