1. INTRODUCTION
1.1. Noviodunum. Location and historical background
The paper is regarding the Roman fortress of Noviodunum, about 2 km eastward from Isaccea town (Tulcea County, Romania), on a promontory on the right bank of the Danube, watching the last ford before the Danube Delta. The fort place has been reused during the time, by Byzantines and Ottoman Turks, in the Middle Age, as well as in the wars of the XXth century (Ştefan, 1973). The most impressive ruins anyway belong to six centuries of Roman civilization.
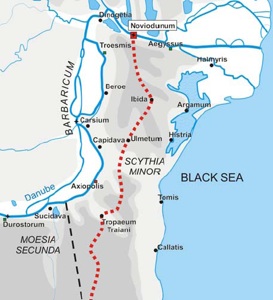
Figure 1. Location of Noviodunum, at the northern end of Marcianopolis road, in the Late Antiquity.
Noviodunum was part of the province named Scythia Minor, in the Late Antiquity, being the end of the Imperial Road from Marcianopolis (Preda, 2000, see fig. 1). Parts of this final sector of the road are still traceable on satellite imagery (fig. 2).
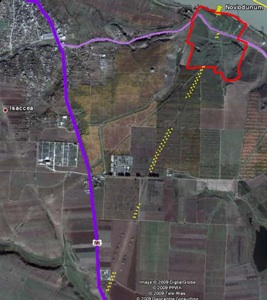
Figure 2. Noviodunum archaeological reservation limits (red) and the presumed roman road (dotted yellow to complete the visible marks), as seen on a Google Earth satellite image.
In Noviodunum are attested, among others, the headquarters of the Classis Flavia Moesica (Danube military fleet), units from legio V Macedonica, for Principate, and the main headquarters of the legio I Iovia Scythica, for the fourth century (and probably later). The civil settlements became municipium during the late second century, surviving on the hostile border until the seventh century. A new and important urban cycle is consuming between the Xth and XVth centuries (Suceveanu and Barnea, 1991; Preda, 2000; PUG, 2000 - 1).
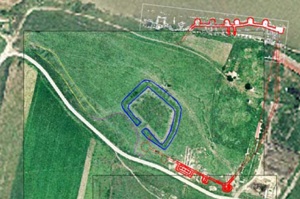
Figure 3. Northern section researched in the 1970s (north, bold red) and southern section researched from 1990s onwards (south, bold red); presumed locations for eastern and western curtains of the eastern fort (thin, red); double precinct for the western fort (yellow); Middle Age Turkish fort (blue). Drawings overlaped on ortophotoplan.
1.2. Archaeological research
The field research at Noviodunum is still in a beginning stage, although it is not recent. The first diggings began in the late ‘50s, were resumed in ‘70s, but not for long. It has been investigated only the northern precinct of the fort, usually laying below the Danube waves, and the corner to the eastern rampart (Barnea et al., 1957; Barnea, 1977). A more consistent digging campaign started in the mid ‘90s, this time on the southern curtain, revealing the first three towers from the east (fig. 3).
Some scattered spot research was performed in the other civil settlement, to the south, as well as in even more distant places, were the cemeteries area (Bauman et al. 1997-2009).
The site is also researched by a British team (Noviodunum Archaeological Project – see NAP) starting from 2000. Those three towers from the southern curtain are, from east to
west, a fan shape tower, on the corner, a U shape tower, a typical curtain tower, and the Large Tower. The later name is fully deserved, being one of the largest towers ever made by the Romans. This sequence of three towers, connected by the curtain, measures 80 meters long, with an average of almost 3 m wide.
Both precinct segments, from north (facing the Danube) and south (facing the hill) date from the first half of the fourth century, with several changes and repairs until the late sixth century (Ştefan, 1973; Barnea and Barnea, 1984; Bauman et al.1997-2009).
1.3. Available data
At the start of our experiment, the topographic survey of the diggings was rather poor. The British team from NAP had already accomplished a general survey, in local coordinates, all over the archaeological reservation (54.7 ha, and some works outside of it), but the details in the Romanian sector were not good enough. We had also aerial orthophotos from the national authority in the matter (ANCPI), satellite imagery from Google Earth, cadastral plans for the reservation (PUG 2000 – 2), an older plan resulted from aerial photographies (Ştefan, 1973) and a plan of the northern fortifications (Barnea and Barnea, 1984).
The superposition of the existing resources (fig. 4) had allowed us to give information about surfaces and dimensions of the ensemble or of some parts, to draw hypotheses about the
enclosure behind the walls, in different historic stages (useful, theoretically, for planning the digging), and a crosschecking of each available document against all others.
The area enclosed by walls is about 9 ha, but our guess is that we have there two distinct fortifications, at least before the fourth century: a military one, the headquarter of the Danube Fleet, and a second fort place which should protect the municipium, at least beginning with the late second century; a city with this status is independent from the military garrison, being usually a pre-existing settlement (Aparaschivei, 2010).
Therefore, we would have a second civil settlement, this time depending on the military garrison, which should be outside the stone walls, but inside the area enclosed by three huge earth ramparts (Ştefan, 1973), settlement extended on at least 7 ha. As concerning the two stone fortresses, it is difficult to tell which is the military garrison and which the municipium, as long as the military port is not known (probably in the west end of the plateau). The hypothesis about the existence of a twin fortification is based on the observation that the sequence of towers from the southern rampart (fan tower, U-tower, large tower) is symmetrical in every of the analogies in the area (Ibida, Capidava, Ulmetum, Troesmis, Iatrus), ending, at the opposite part, with a U-shaped tower and a fan-shaped tower, which is a corner tower. In this situation, the eastern fortification would take about 4.5 ha, with the long side facing east (municipium?). The rest of the plateau, on the western side, covering about other 4 ha, would be taken by the military fortification, with the long axis on a south-east to north-west direction (fig. 3).
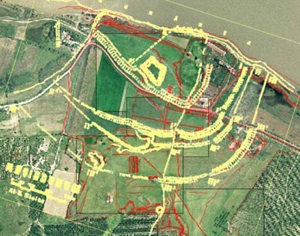
Figure 4. Overlapping of an ortophotoplan with the main landmarks of the site (red) and the Al. Ştefan fortifications plan (yellow), both stone and earthmade.
1.4. Motivation and aims
The foundations of the northern walls of the fort are lying below the Danube level, and nothing much is to do about, unless some expensive engineering works would be ever founded. They can be measured only once a century, when the Danube is extremely low. Some hope to check the plan in the near future comes only from LIDAR technology, working lately also below the water surface (Hesse, 2010).
We have completely other prospects for the southern range of fortifications. The walls reveled by digging request at least a conservation plan, if not more. But any kind of planning begins from the detailed data recording, and that was our job. A middle-term goal could be, besides publishing the results of the research, to protect the ruins from further degradation. At the date, there is no defined project of the kind. Therefore, our work in the field has not been supported by any research plan, or dedicated founds, being with necessity a short one, a feasibility test about what can be done, with low resources, in order to get 2D and 3D representations. The results have been used along a diploma work in architecture (Teodor, 2009), concerning also the conservation and valorization of the site.
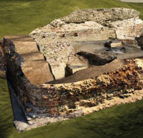
The basic data have been collected for all unearthed walls of the southern rampart, but the detailed 3D survey, with textural detail, was performed only for the Large Tower. This architectural body is not only better preserved (fig. 5), but it is unique in Romania (30.9 x 14.5 m), and a rare thing all over Balkans, as well as in the rest of Europe. Only in the fort from Iatrus (northern Bulgaria) one can find a similar, huge tower (30.5 x 15.2 m, following the plan; see von Bulöw, 2007; see also Iatrus online).
1.5. Overview and references to related work
Photogrammetry is a casual technique for architectural survey (Musso, 2005; Arriaga and Lozano, 2009), being a low-cost and time effective solution. Of course, each case is another case, with different tasks and opportunities. For architectural bodies which are not, for instance, Milano’s Dome or basilica San Marco from Venice, for which any cost is bearable, including laser scanning (Fregonese and Taffurelli, 2009; Scaioni, M. et al. 2009), photogrammetry, with or without a topographic support (Barazzetti et al., 2009; Drap et al., 2009), seams the optimum between goals and meanings (Stojakovic and Tepavcevic, 2009). For Noviodunum, also, in 2007 has been performed a laser scanning against the southern part of the plateau (Venedict et al., 2008), as a part of a completely other project, but the practical results are not published, i.e. we can’t make an evaluation. We don’t know, either, the topographical support of that work, if any.
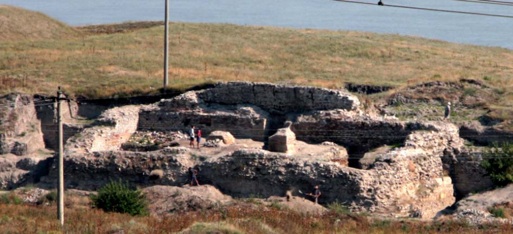
Figure 5. The Large Tower from Noviodunum measures 30.9 x 14.5 meters in plan; elevations are preserved to ca. 5 meters on the outside of the tower. The human scale as shown in this photograph may be more relevant.
2.1. Instruments and method
The classical way to fulfill the job, as an old school archaeologist would do, with a long tape, was from start excluded. The length of the segment to be measured, along the Large Tower and the connected curtains, was about 40 m; the width of the same area is about 15 m; the differences of levels, in the same area, are about 9 m. Such kind of task would be not only dangerous for the personnel, making wall-climbing on ruins, but slow and with huge expected errors.
We should say that everybody from the team involved in this experiment was new in this specific field (3D architectural survey). We have started from an inventory of the existing implements and the present knowledge about using it; the method chosen was a result of that inventory. There were available a total station (Leica TCR 407 Power), a digital camera (Canon EOS 350 D with Tamron Lenses, 18-250 mm), previously calibrated and tested with the soft for photogrammetry (PhotoModeler 6), and AutoCAD 2008. In the meantime, others have been added.
On short, the method implies three major steps: 1. recording data (both topographic and photographic); 2. handling data, getting a topographic survey and a textured 3D object in PhotoModeler; 3. assembling data to get the final product, delivering 2D or 3D surveys.
2.2. Detailed presentation of the method
2.2.1. Recording data. Given the state of the ruin, with broken faces of the wall, when not completely absent (as the external faces of the tower), the well defined surfaces are quite rare. Seeing more emplecton’s irregular stones and broken tegulae, we anticipated great deal of difficulties in retrieving a certain point on several snapshots, taken from very different angles.
The antique mortar within the walls is friable and knocking colored nails in it didn’t seem a practical idea. The solution found – accidentally – was some kid stuff, colored little plastic cubes, filled with sand to be more stable and placed on the ruin in positions with good visibility (fig. 6), necessary for editing in PhotoModeler. The cubes were recorded both in snapshots and with the TS, becoming as many check-points.
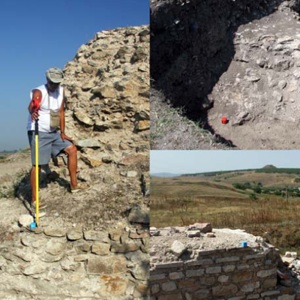
Figure 6. Colored cubes filled with sand had two roles: to help editing the photographic data in PhotoModeler and later to link between the 3D photographic model and the data taken with the total station.
The TS recorded about 500 points, in local coordinates. Simultaneously, snapshots for every taken point have been made, making possible to analyze and later correct all possible
errors or misunderstandings. The task took, for the Large Tower, about 3 hours, and another 4 for the rest.
Figure 7. The three towers-sequence after completing the first phase of data processing (A).
The next step was taking photos for the textured 3D model. Troubles about the minimum number of photographs, in the required angles, especially on the side parts of the exterior, too narrow and poorly lighted, have been encountered, but the 18 mm objective, very wide, was really helpful. Unfortunately it was no time to check on computer (recommended) if the taken snapshots are truly useful, but the problems were solved during an exhausting office job. The field activity took only about two hours, but the office part took several days.
2.2.2. Processing data was the most time-consuming part of the experiment. The exactly amount of it cannot be stated, because it developed along several months, with many interruptions.
Three parallel operations took part, independently but congruently.
A. Data from the total station was imported in AutoCAD through a dxf file. The points were connected manually in 3D polylines (fig. 7), to avoid misleading automation. During the process, the photographic documentary proved itself valuable.
B. Another set of activities was oriented to get a 3D model in PhotoModeler, mainly for the Large Tower. The work was organized in two distinct files, one for the external faces of the
tower, and another for the inner faces and the four pillars. For the inner file were used 762 referenced points, taken from 25 camera locations, with an average error of 3.6 cm, in the real scale; for the outer file were used 748 referenced points, from 20 camera locations, with an average error of 3 cm. It have been exported dxf and 3ds files and different orthophotos for each orientation, in tiff format. The task was carried out with a portable computer with the next configuration: Intel Core2 DUO processor, CPU 2.4 GHz, 3 GB Ram, video card ATI Mobility Radeon HD 3650, on Windows XP.C. In order to have a realistic context for the Large Tower, the topographical survey made by the British team, provided as a dxf file, was compiled in AutoCAD with the TerrainCAD plugin, resulting a 3D model formed from no less than 69000 3D Face objects, scaled, moved and rotated to fit the topographical survey landmarks. The Large Tower was positioned on top, i.e. the PhotoModeler exported files.
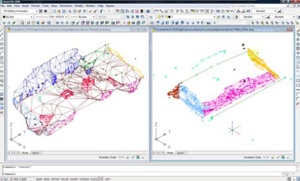
Figure 8. Interior (left) and exterior (right) views of the 3D model of the Large Tower, as resulted from PhotoModeler. Different colored layers are meant to ease working with data.
2.2.3. Assembling processed data was also performed in AutoCAD. The files provided by PhotoModeler were assembled in AutoCAD, getting 1041 3D Face objects for the outer part of the tower, and 1024 3D Faces objects for the inner part (fig. 8).
The position in which each file had to fit in was controlled by specific landmarks, existing both in PhotoModeler and in topographical survey (like the kid’s colored cubes). The result was a new, augmented dwg file, used both for 2D and 3D representations.
The 3D models and orthophotos produced in PhotoModeler (fig. 11) were used for drawing the facades of the walls, as well as in the realistic setup from the final product. For 2D representations (plan and wall faces, see fig. 10) it was employed the same file. After some “cleaning” operations (removing dots, codes and other redundant data), the transition from 3D view to 2D view was achieved by flatten command.
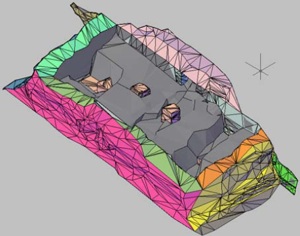
Figure 9. 3D model of the Large Tower obtained from the junction of the outside and inside 3D faces - as resulted from PhotoModeler - and the connecting 3D faces between them.
Some filling gaps were necessary for achieving the final 3D model in AutoCAD. The 3D faces from the inner and the outer parts of the tower were connected together with new 3D objects, without texture, looking less realistic, but with the advantage to make a clear-cut separation and a more “readable” picture (fig. 9).
Processing data in AutoCAD was performed on a portable computer with the next configuration: Intel Core2 DUO CPU 2.4 GHz, 4 GB Ram, video card ATI Mobility Radeon HD 3650, Windows Vista operating system.
The troubles encountered rendering the textures in 3D Studio Max 9 made us to search for concurrent solutions, as Vue xStream 7 (fig. 12). As export-import procedure, the AutoCAD usable 3ds files, exported from 3ds Max.
A desktop computer was used for rendering, with the next configuration: Intel Pentium 4 Dual Core 2.6 GHz, 3 GB Ram, video card GeForce Nvidia 8600 GT, on Windows XP.
2.3. Results and discussions
The final products are as follows: a bi-dimensional plan of the sequence of three towers and the curtain between them, from the southern rampart; a three dimensional textured model for the Large Tower, the best conserved of all three. Both kinds of images could be employed either as technical documentation, or as public presentations tiles. As a technological experiment it was a success, and we are pretty sure that the time spent for reaching the product can be considerably improved. On the other part, the documentation gathered in the process is mirroring the state of the art for archaeological research in 2008, as well as the status of the ruins, the field work being unfinished (inside the Large tower there are yet some 2.5 meters to dig). Of course, the bi-dimensional view of the other two towers in the area cannot be considered a complete architectonic survey; the state of conservation, there, is very poor, with large sectors completely spoiled. Given the real intention – an experiment – the achievement of some detailed sketches for the other two towers represents the maximum target proposed.
In spite of some flaws of the texture or the fact that the volumes are not refined enough, we think that the 3D textured model of the Large Tower reached the target – a realistic and measurable representation of the architectural body. This final product could be anytime merged in a wider site presentation project.
As concerning the method, it has been proved the joint functions of total station and digital photogrammetry, both for assembling data and to gain a cross checked system. Of course, a pretty fine 3D model could be reached exclusively by total station; it would be, yet, difficult to read, and its documentary value diminished by the absence of the raw materials. The photographic texture worth all the efforts.
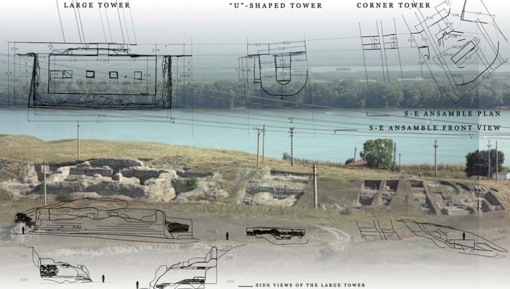
Figure 10. 2D architectural drawings made in AutoCAD for the three towers, overlapped on a snapshot.
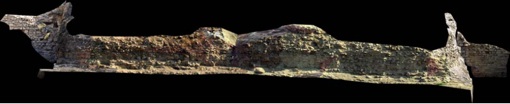
Figure 11. Ortophoto of the southern façade of the Large Tower (ca. 31 meters long),
and connections to the curtain, on sides, as resulted from PhotoModeler.
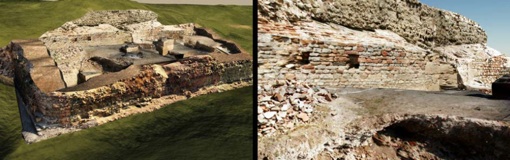
Figure 12. 3D model of the Large Tower rendered in Vue 7 xStream. Views from outside (left) and inside (right) the tower.
3. CONCLUSIONS
The presented test demonstrates a low cost solution for architectural 3D survey on ruined remains. The detailed topographic survey and the photogrammetry 3D objects are the necessary parts of a binomial which excludes annoying errors; in this case, the maximum error is about 3 cm, thus around 0.1% at the object scale. Through practice those errors could be diminished. Also, using newer versions of photogrammetrical softwares (like PhotoModeler 6, version 2011), or some other implements, like a camera scanner, some of the flaws of this application, as well as the time spent on processing data, would be dramatically improved.
Of course, depending on the project budget, other techniques to reach 3D representations could be welcome. A laser scan makes better sense on a finished work, being too expensive to illustrate a stage of the research. Or, exactly that was our intention, closer to documentation than a presentation. Such a product can be further developed in anything else, like the raw material for a restoration project, a site museum project, or a public display, in museums or multimedia.
The report between the necessary time in field (short) and in office (long) recommends this kind of application especially for rescue or preventive archaeology, when the possible time to be spent in the field is sometimes drastically limited.
Beyond pure engineering advances in archaeological techniques, fully textured 3D objects (fig. 13) or computer reconstructions are important for gaining motivation for the local communities, not always aware about the valuable heritage lying below the grass. If this is a general true (if not a truism), it is a dramatic true in some eastern European countries, which not gained, through admission in the EU, the full meaning of protecting monuments in the benefit of their own identities.
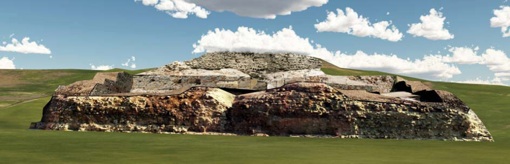
Figure 13. 3D model of the Large Tower rendered in Vue 7 xStream. Main view, from the south.
4. REFERENCES
References from Books
Aparaschivei, D, 2010 – Oraşele romane de la Dunărea Inferioară (sec. I-III p. Chr.), Ed. Universităţii Al. I. Cuza, Iaşi
Bulöw, von, Gerda, 2007 – The Fort of Iatrus in Moesia Secunda: Observations on the Late Roman Defensive System on the Lower Danube (Fourth-Sixth Centuries AD), in The Transition to Late Antiquity, A. G. Poulter (ed), British Academy, London, pp. 459-478.
Preda, C. (coord.), 2000. Enciclopedia Arheologiei şi Istoriei Vechi a României, vol. III, M-Q, Ed. Enciclopedică, Bucharest, s.v. Noviodunum.
Suceveanu, Al. and Barnea, Al., 1991. La Dobroudja romaine, Ed. Enclopedică, Bucharest, pp. 59, 67, 210-211.
References from Journals
Barnea, I., 1977. Noi descoperiri la Noviodunum, Peuce, 4, pp.103-122.
Barnea, I. and Barnea, A. 1984. Săpăturile de salvare de la Noviodunum, Peuce, 9, pp. 97-105, 503-18.
Barnea, I. et al., 1957. Săpăturile de salvare de la Noviodunum, Materiale şi Cercetări Arheologice, IV, pp. 155-174.
Musso, S. F., 2005. Il rilievo di una villa liberty: villa Zanelli a Savona, Recuperare l’Edilizia, 38, pp. 50-59.
Ştefan, Al.-S. 1973. Noviodunum. Studiu de foto-interpretare arheologică, Buletinul Monumentelor Istorice, XLII, pp. 3-14.
Venedict, B.-A. et al., 2008. Isaccea, jud. Tulcea [Noviodunum], Raport topografic, in Cronica Cercetărilor Arheologice din România, 2007 Campaign, XLII-nd National Session of Archaeological Reports, Iaşi, 14-th – 17-th May, p.161.
References from Other Literature
Arriaga, I. K. and Lozano, O. M., 2009. Space throughout time, application of 3D virtual reconstruction and light projection techniques in the analysis and reconstruction of cultural heritage. In: Proceedings of the 3rd ISPRS International Workshop 3D-ARCH 2009.
Barazzetti, L. et al., 2009, Photogrammetric reconstruction of the My Son “G1” Temple in Vietnam. In: Proceedings of the 3rd ISPRS International Workshop 3D-ARCH 2009.
Drap, P. et al., 2009. Going to Shawbak (Jordan) and getting the data back: toward a 3D GIS dedicated to medieval archaeology. In: Proceedings of the 3rd ISPRS International Workshop 3DARCH 2009.
Fregonese, L. and Taffurelli, L. 2009. 3D model for the documentation of cultural heritage: the wooden domes of St. Mark’s basilica in Venice. In: Proceedings of the 3rd ISPRS International Workshop 3D-ARCH 2009.
Scaioni, M. et al. 2009. RC-Heli and structure & motion techniques for the 3-D reconstruction of a Milan Dome spire. In: Proceedings of the 3rd ISPRS International Workshop 3DARCH 2009.
Stojakovic, V. and Tepavcevic, B., 2009. Optimal methods for3D modeling of devastated architectural objects. In: Proceedings of the 3rd ISPRS International Workshop 3DARCH 2009.
References and sources from websites: ANCPI. Ortophotoplans: http://195.138.192.4/kortalromanien/index.asp, from the main site http://ancpi.ro/pages/home.php > Server images (both accessed 31 Jan. 2011).
Bauman, V. et al. 1997-2009. Annual archaeological reports presented at the National Sessions of Archaeology, 1997-2009: http://www.cimec.ro/scripts/ARH/Cronica/selen.asp (accessed 31 Jan. 2011).
Iatrus: http://www.dainst.org/popup.php?media=1248 (accessed 31 Jan. 2011). NAP. Noviodunum Archaeological Project: http://www.ucl.ac.uk/archaeology/research/projects/noviodunum (accessed 31 Jan. 2011).
Other References
Hesse, R., 2010. Baden-Württenberg LIDAR Project, presentation held in 15 Sept. 2010 in Bucharest, at AARG 2010 meeting.
PUG Isaccea 2000 (town planning regulation appendix)
(1) Studiu geoistoric. Situri şi monumente arheologice şi istorice în teritoriul administrativ al oraşului Isaccea, jud. Tulcea, Tulcea County Council – Eco-Museal Research Institute, p. 2.
(2) Plan of the archaeological reservation “Noviodunum fort”, S. C. Geo Topo S. R. L., Tulcea, 1997.
Teodor, A., 2009. Archaeological Park. Preservation and valorification of Noviodunum archaeological site (Isaccea, Tulcea county), April/July, Universitatea de Arhitectură şi Urbanism Ion Mincu, Bucharest (pre-diploma and diploma project).
5. ACKNOWLIDGEMENTS
We are grateful to our colleagues from the archaeological team from Tulcea, which are conducting the field research on Noviodunum, for being good hosts. We are indebt to the British team from Noviodunum Archaeological Project, for providing us the survey files of the reservation. Last but not least, the History National Museum from Bucharest had given us all
technical necessary support.
Noviodunum Roman Fortress. A Survey on a City Wall Section
Young Author Award
3D-ARCH International Workshop, 2-5 March 2011, Trento, Italy
Alexandra Teodor (a), E. S. Teodor (b), M. S. Florea (b), M. A. Popescu (b)
(a) University of Architecture and Urbanism “Ion Mincu”, Academiei 18-20, 010014, Bucharest, Romania
(b) National History Museum of Romania, Calea Victoriei 12, 030026, Bucharest, Romania
(esteo, mihaiu, mircea)@mnir.ro

The paper presents in detail the method used to acquire 2D and 3D representations for the Large Tower of the Roman fortress from Noviodunum (Isaccea, Tulcea County). The available implements were a total station, a digital camera and some software for handling data. The method is not new by any rate, but well fitted to the aims – recording archaeological data on ruined but massif walls, with rough surfaces – and with a limited budget. Lately considered as a low cost procedure, laser scanning is still costly and rare in some East-European countries. Our method, as simple as it is, provides reliable data as a 3D survey, along texture details, at the lowest price, on unfinished fieldwork, preserving and picturing a stage of knowledge about the site and the architectural bodies.
Keywords: Archaeology, Architecture, Cultural Heritage, Roman fortress,
3D Photogrammetry, 3D Modeling, Survey